Wednesday, September 30, 2009

Designing Simple Dashboards with .NET ASP Chart Controls and web parts

In our last post, we had explained how we could integrate SRS reports in Web Parts and make a user friendly Dashboard easily.

The Dashboard work just great… but on the presentation front, SRS report is not that flexible and it takes up a lot of space with the additional toolbars that the Reportviewer bring along. Yes there are few options that can be passed along in the querystring to hide these additional toolbars but then it doesn’t seem to work across all versions.

You must have come across a number of third party chart tools that help you create fancy looking charts. We decided to use the freely available .NET Chart controls available from Microsoft. Today we explain how we could use these controls to make easy to use and fancy looking charts that can be integrated in the webparts to enhance our Dashboard.

.NET charts enable you to design various types of charts


  • Area

  • FastLine

  • Pyramid

  • SplineArea

  • Bar

  • FastPoint

  • Radar

  • SplineRange

  • BoxPlot

  • Funnel

  • Polar

  • StackedArea

  • Bubble

  • Kagi

  • Range

  • StackedArea100

  • CandleStick

  • Line

  • RangeBar

  • StackedBar

  • Column

  • Pie

  • RangeColumn

  • StackedBar100

      • Doughnut

      • Point

      • Renko

      • StepLine

      • ThreeLineBreak

      • PointAndFigure

      • Spline

      • Stock

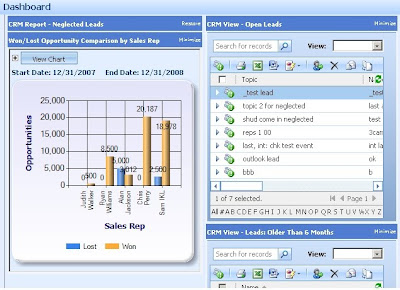
      Lets pickup a simple column chart example that shows Won/Lost Opportunity comparison by Sales Rep.

      1. The first step is to design the SQL query to retrieve the required information. We would need to design the query to return the result in the following table format

      Sales Rep Won Opp $ Lost Opp $

      2. So we have 2 series that need to plotted the Won Opp series and the Lost Opp series. The two series would be assigned to the Y-Axis. The Sales Rep being on the X-axis.

      3. Once you have the query ready and you have decided on the X and Y axis series, you just have to go ahead and set these as the chart properties.

      // Set chart data source
      chart1.DataSource = myCommand;

      //Set the Chart Type
      chart1.Series["Series 1"]. ChartType = SeriesChartType.Column;
      chart1.Series["Series 2"]. ChartType = SeriesChartType. Column;

      // Set series members names for the X and Y values
      chart1.Series["Series 1"].XValueMember = "Sales Rep";
      chart1.Series["Series 1"].YValueMembers = "Won Opp $";
      chart1.Series["Series 2"].YValueMembers = "Lost Opp $";

      // Data bind to the selected data source
      chart1.DataBind();

      The ValueMember above needs to refer to a column of the SQL query designed.

      Note: If you wanted this to be a Bar chart instead… no fuss just change the chart type of series to bar chart

      chart1.Series["Series 1"]. ChartType = SeriesChartType.Bar;
      chart1.Series["Series 2"]. ChartType = SeriesChartType.Bar;

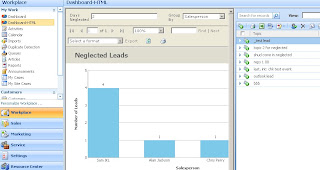
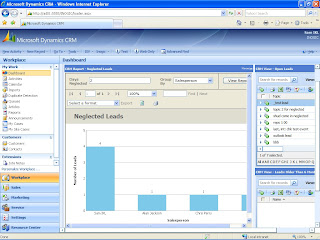
      4. Placing a chart control on a web form and binding it with the data as explained above, you should have a web page ready that displays a fancy looking chart ready.
      5. Next step would be to add the URL to this page in your Web part Dashboard and voila you have integrated this with Web Parts as well and now you can benefit from the features of both the tools.


      Hope you get going!!!

      Friday, September 25, 2009

      Designing Simple Dashboards with SRS reports and web parts

      At the very basic level, you can design an HTML page with multiple IFRAMES added. Each IFRAME includes the path to the SRS report or one of the CRM views or another html page, probably the URL of a another website… You can place the IFRAME in an HTML table and design the layout of your Dashboard.

      <html>
      <body bgcolor="#E3EFFF" leftmargin="0" topmargin="0">
      <table border ="1">
      <tr height="100%">
      <td>
      <iframe height="550" width="500" src="
      http://ad01/ReportServer?%2fINOGIC_MSCRM%2f4.0%2f%7bec3b0bf7-0ab5-dc11-94ac-000c29b366df%7d&rs:Command=Render" />
      </td>
      <td>
      <iframe height="550" width="300" src="
      http://ad01:5555/Inogic/_root/homepage.aspx?etc=4&viewid=00000000-0000-0000-00aa-000010001006" />
      </td>
      </tr>
      </table>
      </body>
      </html>

      And


      The issue with this one could be that it is a static dashboard and the users do not have much control over the presentation.

      This can be taken a step forward by giving more control to the user by using the concept of Web Parts.


      Briefly the steps would be

      1. Design a web form and add the Web Part Zone control. The Web Part Zone allows you to design the layout of your page i.e whether the reports added appear Horizontally aligned or Vertically aligned or a combination of both.

      2. Once the layout is defined. You add the Web Part control. This control will hold your reports.

      3. You can add an IFRAME within the Web Part and set the URL to the report/page that needs to be displayed.

      The benefit of using Web Parts is that it stores the personalization information of each individual user automatically. So if the user had changed the position of one of the reports in the layout from the left to the right, this change is stored and next time when the user logs on their individual preference is read and displayed accordingly.

      Additionally you can provide the drag and drop capabilities


      Or even minimize one of the reports to save space.


      Well designing Dashboards using web parts is definitely worth exploring further.

      Thursday, September 24, 2009

      How to read the record selection from the ISV buttons added to the Grid

      The buttons added to the CRM grids allow the user to select multiple records from the Grid and perform the said operation on all the selected records.

      It is very easy to add a button on an entity grid. You need to add the button tag to the Grid section as explained below. It is important that for the selected record information to be passed on to the receiving page, the page should be displayed in a Modal window. Hence the Winmode for the button should be “2”

      <Entity name="account"><Grid><MenuBar><Buttons>

      <Button Icon="/_imgs/ico_18_debug.gif" Url="/ISV/test.htm" WinMode="2">

      <Titles><Title LCID="1033" Text="Get GUIDS" /></Titles>

      <ToolTips><ToolTip LCID="1033" Text="Get GUIDS for selected records" /></ToolTips>

      </Button>

      </Buttons></MenuBar></Grid></Entity>

      Now, we need to be able to read the record selection from the grid on the custom page. The record selection is passed to the receiving page as a comma separated list of entityid’s of the selected records from the grid. This is enclosed in the <record></record> tags.

      If you want to read the information through server-side code you can read it using Request.InputStream.

      StreamReader sr = new StreamReader(Request.InputStream);
      string recordIds = sr.ReadToEnd();


      Since it is enclosed in <record> tag it can be read as XML string
      XmlDocument xmlDoc = new XmlDocument();
      xmlDoc.LoadXml(recordIds);
      selectedEntities = xmlDoc.DocumentElement.InnerText;

      and the information then split by comma to extract the list of ids.
      return selectedEntities.Split(new char[] { ',' });

      If you want to read this information from client side through jscript… you will get the id using window.dialogArguments and then you can perform the same operations as above.

      Wednesday, September 23, 2009

      How to design a Custom Activities/History tab to show Activity Party information

      There have often been requests for displaying the Activity Parties in the Activities/History tab of Account/Contact.

      The details in these views are gathered from the ActivityPointer entity. The activity pointer entity is not customizable and so you are stuck with not having the activity party information like Sender/Receiver not being available for reference in the views.

      However it is not that difficult to get a custom page to develop that does just this.

      Let’s look at the various aspects related to this.

      1. The Activities/History tab display not only activities directly associated with the account but also related entities of account.

      How do we get this? The answer lies in the “TargetRollupActivityPointer” messages available in the SDK.

      There are three different variation of this message available

      · TargetRollupActivityPointerByAccount
      · TargetRollupActivityPointerByContact
      · TargetRollupActivityPointerByOpportunity

      Searching the SDK for these messages should help you get you going with these messages.

      // Create the target for the request.
      TargetRollupActivityPointerByAccount target = new TargetRollupActivityPointerByAccount();
      target.AccountId = new Guid("A0F87168-4B00-4CA2-925D-AA0A4C47B86F");

      2. Get the Activity Parties Associated with these activities.

      The information regarding the parties involved in an activity is not stored along with the activity but rather in a separate entity called activityparty.

      You can query for activity party and search for activityid = activitypointer.activityid.

      Note the result will return more than one records. This entity stores not just the sender/receiver but also the owner and organizer and such other activity party information. The participation type mask attribute describes the role of this party in the activity (search for activitypartytype in SDK for the entire list).

      // Create the ConditionExpression.
      ConditionExpression condition = new ConditionExpression();

      // Set the ConditionExpressions Properties so that the condition is true
      condition.AttributeName = "activityid";
      condition.Operator = ConditionOperator.Equal
      condition.Values = new string [] {activityid.ToString()};

      // Set the properties of the QueryExpression
      query.EntityName = EntityName.activityparty.ToString
      query.ColumnSet = new AllColumns();

      3. If you want to go further and be ambitious enough to add a column for displaying an attachment flag in case of emails with attachment.

      CRM store the Email attachment information in the "activitymimeattachment" entity. You can filter this entity and look for activityid = activitypointer.activityid. If it returns any row it has attachments associated with it and you can add “true” flag for this.


      // Create the ConditionExpression
      ConditionExpression condition = new ConditionExpression

      // Set the ConditionExpressions Properties so that the condition is true
      condition.AttributeName = "activityid
      condition.Operator = ConditionOperator.Equal
      condition.Values = new string [] {emailId.ToString()};

      // Set the properties of the QueryExpression
      query .EntityName = EntityName. activitymimeattachment.ToString(); query.ColumnSet = new AllColumns();


      Following the 3 – steps explained above you can get your custom page working the way you want.

      Monday, September 14, 2009

      Add Shortcut button for new Activity on CRM toolbar

      Some time back we had posted a script that would allow you to create an ISV button to bring up the new activity form (phone call, appointment etc).

      Recently we had the same request from one of our customers and we were quick to offer them the same. Unfortunately it failed. The locAddActTo function is not available on main CRM form.

      To get this done, we had to provide the following alternate script


      <Button Icon="/_imgs/ico_16_4210_d.gif" JavaScript="window.open('/activities/phone/edit.aspx','null','height=500px,width=800px,resizable=1,status=yes,toolbar=no,menubar=no,location=no')"> <Titles> <Title LCID="1033" Text="New Phonecall" /> </Titles> <ToolTips> <ToolTip LCID="1033" Text="Create New Phonecall" /> </ToolTips>

      </Button>

      Tuesday, September 1, 2009

      Sales Quotas for Sales Person in Dynamics CRM

      One of the not so widely discussed features of Dynamics CRM is the Sales Quota. You are bound to have missed this feature unless you have completed the Fiscal Year settings of the CRM organization.

      To set the fiscal settings of the system, Go to settings Business Management and click on the Fiscal Year Settings.

      Suppose you have set the following setting shown in the below screenshot.

      Once the fiscal settings have been defined, the Sales Quota option is available on the System User record for settings the Sales quota of a Salesperson based on the first period settings.

      You can set the Quotas for different fiscal periods as shown in the below screenshot. The fiscal period displayed in the below screen depends on the fiscal period settings in the above screen.


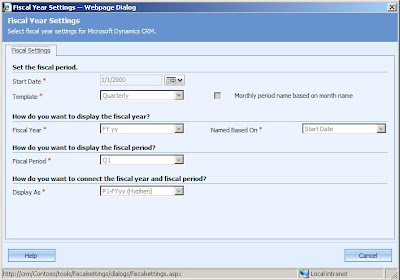
      The Current Fiscal year tab will display the Current Year quota defined for the particular Salesperson.

      Though CRM provides a way to define the Sales quota for a Salesperson, it ends at that and there is a lot left to be done in this area. They have not provided for any Actual/Quota comparison that would be considered essential once the Quota has been defined. There is a lot of scope for developing this functionality further through add-ons.