Showing posts with label Dashboards. Show all posts

Tuesday, March 2, 2010

How to add scroll bar to CRM Dashboard accelerator

The CRM Dashboard accelerator released displays Dashboards in its Workplace. However there is one issue with it, that being that it does not provide scrollbars to scroll through the page to view all the available charts on the screen.

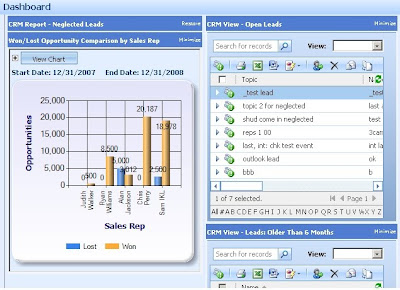
In this blog we have describe how to add the scrollbar for this report page.

For this we need to do some changes in the “sitemap” file and add one custom page with iframe control.

Steps are:
1) Create the custom page (DBpage.aspx) with following code.

<html>
<head>
<title>Dashboard</title>
<style type="text/css">HTML { SCROLLBAR-FACE-COLOR: #ffffff; SCROLLBAR-HIGHLIGHT-COLOR: #6699cc; SCROLLBAR-SHADOW-COLOR: #6699cc; SCROLLBAR-ARROW-COLOR: #6699cc; SCROLLBAR-TRACK-COLOR: #e3efff }
</style>
<script type="text/javascript">
//function will set the height and width of the iframe
function calcHeightWidth()
{
//initialize variables
var main_height = null;
var main_width = null;
var height = null;
var width = null;

// for all except Explorer
if (self.innerHeight) {
main_height = self.innerHeight;
main_width = self.innerWidth;
// Explorer 6 Strict Mode
} else if (document.documentElement
&& document.documentElement.clientHeight) {
main_width = document.documentElement.clientWidth;
main_height = document.documentElement.clientHeight;
// other Explorers
} else if (document.body) {
main_height = document.body.clientHeight;
main_width = document.body.clientWidth;
}
//set final height and width
height = main_height + 'px';
width = main_width + 'px';

//change the height of the iframe
document.getElementById('dashboardframe').style.height=height;
document.getElementById('dashboardframe').style.width=width;
}
</script>
</head>
<body onload="calcHeightWidth();" onresize="calcHeightWidth();" leftmargin="0" topmargin="0" >
<form id="form1">
<div id="MainFrame" style="overflow:auto;">
<iframe id="dashboardframe" visible="true" frameborder="0" src="
http://crm-srv-01/reportserver?%2fCRM+Accelerator+Dashboards%2fSales+Manager+Dashboard&rs:Command=Render,menu=no&rc:Parameters=False;" >
</iframe>
</div>
</form>
</body></html>

After creating page, add this page under ”/ISV/NewFolder” location in the CRM web root.

2) Change URL of Dashboard subarea to be:
//Here we set the location of custom page
<SubArea Id="Dashboard" Title="Dashboard" Url="/ISV/NewFolder/DBpage.aspx" Icon="/_imgs/bar_bottom_ico_reports.gif" />

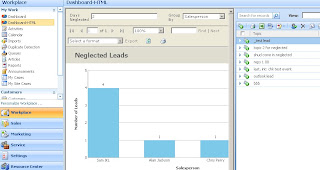
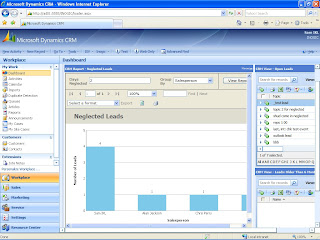
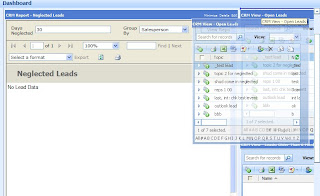
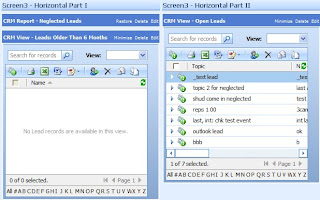
3) Clear the browser history and do iisreset to apply the changes and see the result as shown in below screen shot.


Monday, January 25, 2010

InoDashboard – Dynamics CRM Business Intelligence Dashboard released

Dynamics CRM requires a comprehensive tool for monitoring the KPI in a visual/dashboard format. Inogic labs has come up with InoDashboard, a Business Intelligence Dashboard designed for Microsoft Dynamics CRM to fill in this gap. This tool will allow the CRM users at each level to design a dashboard specific to them and include the reports and monitor areas specific to their interest.

It comes along with a pre-packaged bundle of about 40+ reports that provide you with the most commonly requested reports for monitoring the KPI. Whats more is that with the wizard kind of UI it is very easy to develop your own custom reports/charts with basic knowledge of writing SQL queries. The Dashboard can be seen as below screen shot.


Its feature set includes

  • Easy to create reports to analyze your CRM data.
  • No learning curve required. Use your SQL query writing skills to design reports.

  • Ability to add CRM reports, views, custom website URL
  • User personalization available.
  • Secured reports. Pre-defined reports use Filtered Views to force inbuilt CRM security.
  • Ability to drill down to CRM entity forms.

Technical details

  • It is developed using .NET Chart control for designing the various charts
  • It makes extensive use of Web parts to support personalization
  • It supports the following types of charts shown in the screen shot.

  • It supports Dynamics CRM 4.0 On-premise with IFD

  • We have come up with this after a lot of research in this area some of our r n d was put up in our earlier blogs http://inogic.blogspot.com/search/label/Dashboards where we studied the various ways in which a dashboard could be presented in Dynamics CRM.

    Wednesday, September 30, 2009

    Designing Simple Dashboards with .NET ASP Chart Controls and web parts

    In our last post, we had explained how we could integrate SRS reports in Web Parts and make a user friendly Dashboard easily.

    The Dashboard work just great… but on the presentation front, SRS report is not that flexible and it takes up a lot of space with the additional toolbars that the Reportviewer bring along. Yes there are few options that can be passed along in the querystring to hide these additional toolbars but then it doesn’t seem to work across all versions.

    You must have come across a number of third party chart tools that help you create fancy looking charts. We decided to use the freely available .NET Chart controls available from Microsoft. Today we explain how we could use these controls to make easy to use and fancy looking charts that can be integrated in the webparts to enhance our Dashboard.

    .NET charts enable you to design various types of charts


    • Area

    • FastLine

    • Pyramid

    • SplineArea

    • Bar

    • FastPoint

    • Radar

    • SplineRange

    • BoxPlot

    • Funnel

    • Polar

    • StackedArea

    • Bubble

    • Kagi

    • Range

    • StackedArea100

  • CandleStick

  • Line

  • RangeBar

  • StackedBar

  • Column

  • Pie

  • RangeColumn

  • StackedBar100

      • Doughnut

      • Point

      • Renko

      • StepLine

      • ThreeLineBreak

      • PointAndFigure

      • Spline

      • Stock

      Lets pickup a simple column chart example that shows Won/Lost Opportunity comparison by Sales Rep.

      1. The first step is to design the SQL query to retrieve the required information. We would need to design the query to return the result in the following table format

      Sales Rep Won Opp $ Lost Opp $

      2. So we have 2 series that need to plotted the Won Opp series and the Lost Opp series. The two series would be assigned to the Y-Axis. The Sales Rep being on the X-axis.

      3. Once you have the query ready and you have decided on the X and Y axis series, you just have to go ahead and set these as the chart properties.

      // Set chart data source
      chart1.DataSource = myCommand;

      //Set the Chart Type
      chart1.Series["Series 1"]. ChartType = SeriesChartType.Column;
      chart1.Series["Series 2"]. ChartType = SeriesChartType. Column;

      // Set series members names for the X and Y values
      chart1.Series["Series 1"].XValueMember = "Sales Rep";
      chart1.Series["Series 1"].YValueMembers = "Won Opp $";
      chart1.Series["Series 2"].YValueMembers = "Lost Opp $";

      // Data bind to the selected data source
      chart1.DataBind();

      The ValueMember above needs to refer to a column of the SQL query designed.

      Note: If you wanted this to be a Bar chart instead… no fuss just change the chart type of series to bar chart

      chart1.Series["Series 1"]. ChartType = SeriesChartType.Bar;
      chart1.Series["Series 2"]. ChartType = SeriesChartType.Bar;

      4. Placing a chart control on a web form and binding it with the data as explained above, you should have a web page ready that displays a fancy looking chart ready.
      5. Next step would be to add the URL to this page in your Web part Dashboard and voila you have integrated this with Web Parts as well and now you can benefit from the features of both the tools.


      Hope you get going!!!

      Friday, September 25, 2009

      Designing Simple Dashboards with SRS reports and web parts

      At the very basic level, you can design an HTML page with multiple IFRAMES added. Each IFRAME includes the path to the SRS report or one of the CRM views or another html page, probably the URL of a another website… You can place the IFRAME in an HTML table and design the layout of your Dashboard.

      <html>
      <body bgcolor="#E3EFFF" leftmargin="0" topmargin="0">
      <table border ="1">
      <tr height="100%">
      <td>
      <iframe height="550" width="500" src="
      http://ad01/ReportServer?%2fINOGIC_MSCRM%2f4.0%2f%7bec3b0bf7-0ab5-dc11-94ac-000c29b366df%7d&rs:Command=Render" />
      </td>
      <td>
      <iframe height="550" width="300" src="
      http://ad01:5555/Inogic/_root/homepage.aspx?etc=4&viewid=00000000-0000-0000-00aa-000010001006" />
      </td>
      </tr>
      </table>
      </body>
      </html>

      And


      The issue with this one could be that it is a static dashboard and the users do not have much control over the presentation.

      This can be taken a step forward by giving more control to the user by using the concept of Web Parts.


      Briefly the steps would be

      1. Design a web form and add the Web Part Zone control. The Web Part Zone allows you to design the layout of your page i.e whether the reports added appear Horizontally aligned or Vertically aligned or a combination of both.

      2. Once the layout is defined. You add the Web Part control. This control will hold your reports.

      3. You can add an IFRAME within the Web Part and set the URL to the report/page that needs to be displayed.

      The benefit of using Web Parts is that it stores the personalization information of each individual user automatically. So if the user had changed the position of one of the reports in the layout from the left to the right, this change is stored and next time when the user logs on their individual preference is read and displayed accordingly.

      Additionally you can provide the drag and drop capabilities


      Or even minimize one of the reports to save space.


      Well designing Dashboards using web parts is definitely worth exploring further.