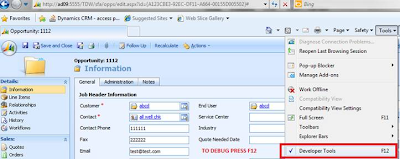
With Internet Explorer 8 and JScript Libraries, debugging scripts has become much easier. To debug the script, Please follow the step below.
- When working with Microsoft Dynamics CRM try to reproduce the conditions where an error is occurring press F12 to open the Internet Explorer developer tools.
- On the Script tab, to the right of the Start Debugging button, use the drop-down to locate your JScript library.
- Set a breakpoint by clicking on the left margin within your function.
- Click Stop Debugging to stop debug.
- If your script is in the Onload event, you may need to select the Microsoft Dynamics CRM window and press F5 to reload the window.


Hope this helps!
No comments:
Post a Comment